CanvasXpress for Python Examples
This section provides CanvasXpress for Python usage examples that cover typical platforms and scenarios. The emphasis is on the Python package rather than CanvasXpress APIs, and for the latter the CanvasXpress documentation is a strongly recommended read:
A Script/Console Example
Charts can be defined in scripts or a console session and then displayed using the default browser, assuming that a graphical browser with Javascript support is available on the host system.
First install CanvasXpress for Python:
pip install -U canvasxpress
Then create a script (.py file) with the following content:
from canvasxpress.canvas import CanvasXpress
from canvasxpress.config.collection import CXConfigs
from canvasxpress.config.type import CXGraphType, CXGraphTypeOptions
from canvasxpress.data.keypair import CXDictData
from canvasxpress.render.popup import CXBrowserPopup

if __name__ == "__main__":
    # Define a CX bar chart with some basic data
    chart: CanvasXpress = CanvasXpress(
        render_to="example_chart",
        data=CXDictData(
            {
                "y": {
                    "vars": ["Gene1"],
                    "smps": ["Smp1", "Smp2", "Smp3"],
                    "data": [[10, 35, 88]]
                }
            }
        ),
        config=CXConfigs(
            CXGraphType(CXGraphTypeOptions.Bar)
        )
    )

    # Display the chart in its own Web page
    browser = CXBrowserPopup(chart)
    browser.render()
Execute the script on the console or in an IDE. Upon running the example the following chart will be displayed on systems such as MacOS X, Windows, and Linux with graphical systems:
A Flask Web Example
Flask is a popular lean Web development framework for Python based applications. Flask applications can serve Web pages, RESTful APIs, and similar backend service concepts. This example shows how to create a basic Flask application that provides a basic Web page with a CanvasXpress chart composed using Python in the backend.
The concepts in this example equally apply to other frameworks that can serve Web pages, such as Django and Tornado.
Create a Basic Flask App
A basic Flask app provides a means by which:
- A local, development server can be started
- A function can respond to a URL
First install Flask and CanvasXpress for Python:
pip install -U flask canvasxpress
Then create a demo file, such as app.py, and insert:
# save this as app.py
from flask import Flask

app = Flask(__name__)


@app.route('/')
def canvasxpress_example():
    return "Hello!"
On the command line, execute:
flask run
And output similar to the following will be provided:
Running on http://127.0.0.1:5000/ (Press CTRL+C to quit)
Browsing to http://127.0.0.1:5000/ will result in a page with the text
Hello!.
Cancel the flask application's execution using ctrl+c.
Add a Chart
CanvasXpress for Python can be used to define a chart with various attributes and then generate the necessary HTML and Javascript for proper display in the browser.
Now add a templates directory to the same location as the app.py file.
Inside add a file called canvasxpress_example.html. Inside the file add:
<html>
<head>
    <meta charset="UTF-8">
    <title>Flask CanvasXpress Example</title>

    <!-- 2. Include the CanvasXpress library -->
    <link
            href='https://www.canvasxpress.org/dist/canvasXpress.css'
            rel='stylesheet'
            type='text/css'
    />
    <script
            src='https://www.canvasxpress.org/dist/canvasXpress.min.js'
            type='text/javascript'>
    </script>

    <!-- 3. Include script to initialize object -->
    <script type="text/javascript">
        onReady(function () {
            {{canvas_source|safe}}
        })
    </script>

</head>
<body>

<!-- 1. DOM element where the visualization will be displayed -->
{{canvas_element|safe}}

</body>
</html>
The HTML file, which uses Jinja syntax achieves three things:
- Provides a location for a
<div>element that marks where the chart will be placed. - References the CanvasXpress CSS and JS files needed to illustrate and operate the charts.
- Provides a location for the Javascript that will replace the chart
<div>with a working element on page load.
Going back to our Flask app, we can add a basic chart definition with some data to our example function:
from flask import Flask, render_template

from canvasxpress.canvas import CanvasXpress
from canvasxpress.config.collection import CXConfigs
from canvasxpress.config.type import CXGraphType, CXGraphTypeOptions
from canvasxpress.data.keypair import CXDictData

app = Flask(__name__)


@app.route('/')
def canvasxpress_example():
    # Define a CX bar chart with some basic data
    chart: CanvasXpress = CanvasXpress(
        render_to="example_chart",
        data=CXDictData(
            {
                "y": {
                    "vars": ["Gene1"],
                    "smps": ["Smp1", "Smp2", "Smp3"],
                    "data": [[10, 35, 88]]
                }
            }
        ),
        config=CXConfigs(
            CXGraphType(CXGraphTypeOptions.Bar)
        )
    )

    # Get the HTML parts for use in our Web page:
    html_parts: dict = chart.render_to_html_parts()

    # Return a Web page based on canvasxpress_example.html and our HTML parts
    return render_template(
        "canvasxpress_example.html",
        canvas_element=html_parts["cx_canvas"],
        canvas_source=html_parts["cx_js"]
    )
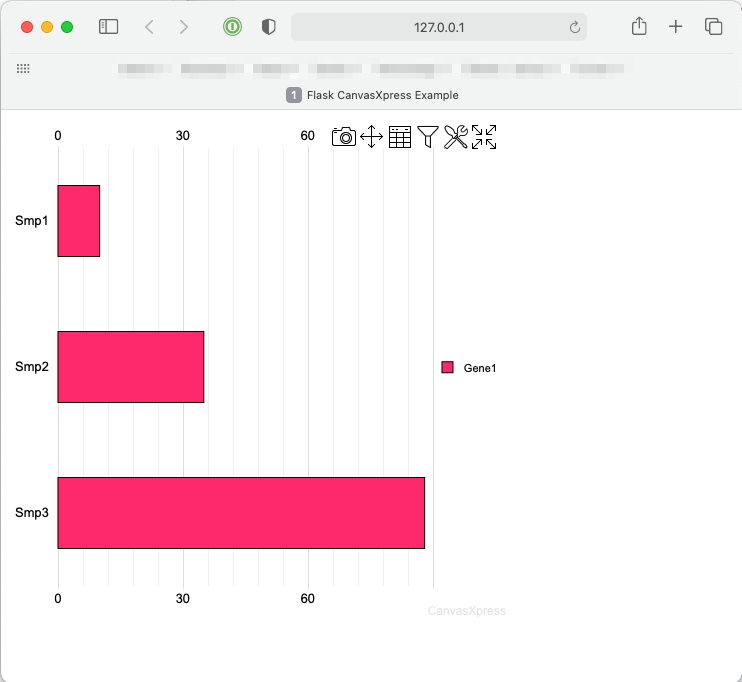
Rerun the Flask app on the command line and browse to the indicated IP and URL. A page similar to the following will be displayed:

Congratulations! You have created your first Python-driven CanvasXpress app!
A Plotly Dash Example
Plotly Dash is a popular dashboard framework similar to R/shiny for Python. Dash applications are Web pages with widgets and elements facilitating the interactive presentation of information. This example shows how to create a basic Dash application using a CanvasXpress Dash element.
Create a Basic Dash App
A basic Dash app provides a means by which:
- A local development server can be started
- A function can respond to a URL
First install Dash and CanvasXpress for Python:
pip install canvasxpress[dash]
Then create a demo file, such as app.py, and insert:
from dash import Dash, html
from canvasxpress.canvas import CanvasXpress
from canvasxpress.render.dash import CXElementFactory

g_app = Dash(__name__)

# No need to create_element many forms of data into CanvasXpress data objects; for example, use this CSV as-is.
_g_csv = """, Apples, Oranges, Bananas
SF      ,      4,       1,       2
Montreal,      2,       4,       5
"""

_g_cx_colors = {
    "background": "#111111",
    "text": "rgb(127,219,255)",
    "bars": ["rgb(99,110,250)", "rgb(239,85,59)"],
}

# Work with data as normal Python values.  cx_data could also have been a DataFrame, JSON, URL, etc.
_g_cx_chart = CanvasXpress(
    render_to="fruit_consumption",
    data=_g_csv,
    config={
        "colors": _g_cx_colors["bars"],
        "graphOrientation": "vertical",
        "smpLabelRotate": 90,
        "plotBox": True,
        "plotBoxColor": "White",
        "background": _g_cx_colors["background"],
        "theme": "Plotly",
        "xAxis": ["Fruit", "City"],
        "xAxisTitle": "Amount",
        "xAxis2Show": False,
        "xAxisMinorTicks": False,
        "axisTitleColor": _g_cx_colors["text"],
        "axisTickColor": _g_cx_colors["text"],
        "legendColor": _g_cx_colors["text"],
        "smpTitle": "Fruit",
        "smpTitleFontColor": _g_cx_colors["text"],
        "smpLabelFontColor": _g_cx_colors["text"],
    },
    width=650,
    height=450,
)

# Application
g_app.layout = html.Div(
    style={"backgroundColor": _g_cx_colors["background"]},
    children=[
        html.H1(
            children="Hello Dash",
            style={"textAlign": "center", "color": _g_cx_colors["text"]},
        ),
        html.H2(
            children=(
                "An Example of the Advanced CanvasXpress and CXDashElementFactory"
                " Classes for Plotting a CanvasXpress Chart"
            ),
            style={"textAlign": "center", "color": _g_cx_colors["text"]},
        ),
        html.Div(
            id="chart-container",
            children=[
                html.Div(
                    id="cx-container",
                    style={"textAlign": "center"},
                    children=CXElementFactory.render(_g_cx_chart),
                ),
            ],
        ),
    ],
)

if __name__ == "__main__":
    g_app.run_server(debug=True)
Run the App and View the Page
On the command line, execute:
python3 app.py
And output similar to the following will be provided:
Running on http://127.0.0.1:8050/ (Press CTRL+C to quit)
Browsing to http://127.0.0.1:8050/ will result in a page with a CanvasXpress chart, which is being hosted by the
Dash framework:
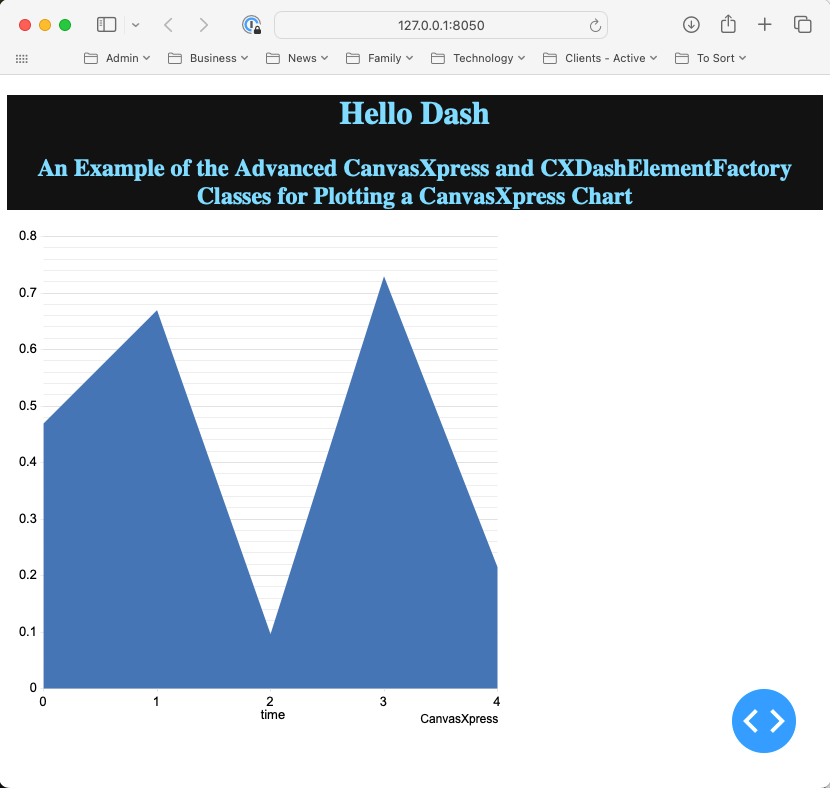
Congratulations! You have created a Plotly Dash CanvasXpress app!
A Jupyter Notebook Example
Jupyter Notebook is a programming journal, among other things, based in part on the powerful IPython framework. CanvasXpress for Python provides built-in support for IPython Web containers.
Assuming familiarity with Jupyter Notebooks, create a new Notebook based on the Python3 kernel.
Install canvasxpress and Supporting Packages
First, the canvasxpress package and supporting requirements need to be installed. This can be performed by the system administrator or, for Notebooks with proper user permissions, the packages can be installed via the Notebook.
The install command for canvasxpress in Jupyter Notebooks is:
import sys
# Install canvasxpress and its required packages
!{sys.executable} -m pip install -U canvasxpress
# List all packages in the environment to confirm installation
!{sys.executable} -m pip list
Caution: The Jupyter Notebook kernel might not load the installed packages, depending on the system's configuration. Reloading the kernel will ensure that the updated or new packages can be used.
Draw a Chart
CanvasXpress for Python includes a class, CXNoteBook, that properly renders
CanvasXpress charts in Jupyter Notebooks (and similar IPython environments).
from canvasxpress.canvas import CanvasXpress
from canvasxpress.config.collection import CXConfigs
from canvasxpress.config.type import CXGraphType, CXGraphTypeOptions
from canvasxpress.data.keypair import CXDictData
from canvasxpress.render.jupyter import CXNoteBook

# Define a CX bar chart with some basic data
chart: CanvasXpress = CanvasXpress(
    render_to="example_chart",
    data=CXDictData(
        {
            "y": {
                "vars": ["Gene1"],
                "smps": ["Smp1", "Smp2", "Smp3"],
                "data": [[10, 35, 88]]
            }
        }
    ),
    config=CXConfigs(
        CXGraphType(CXGraphTypeOptions.Bar)
    )
)

demo_nb = CXNoteBook(chart)
demo_nb.render()
Executing that cell will result in output similar to:
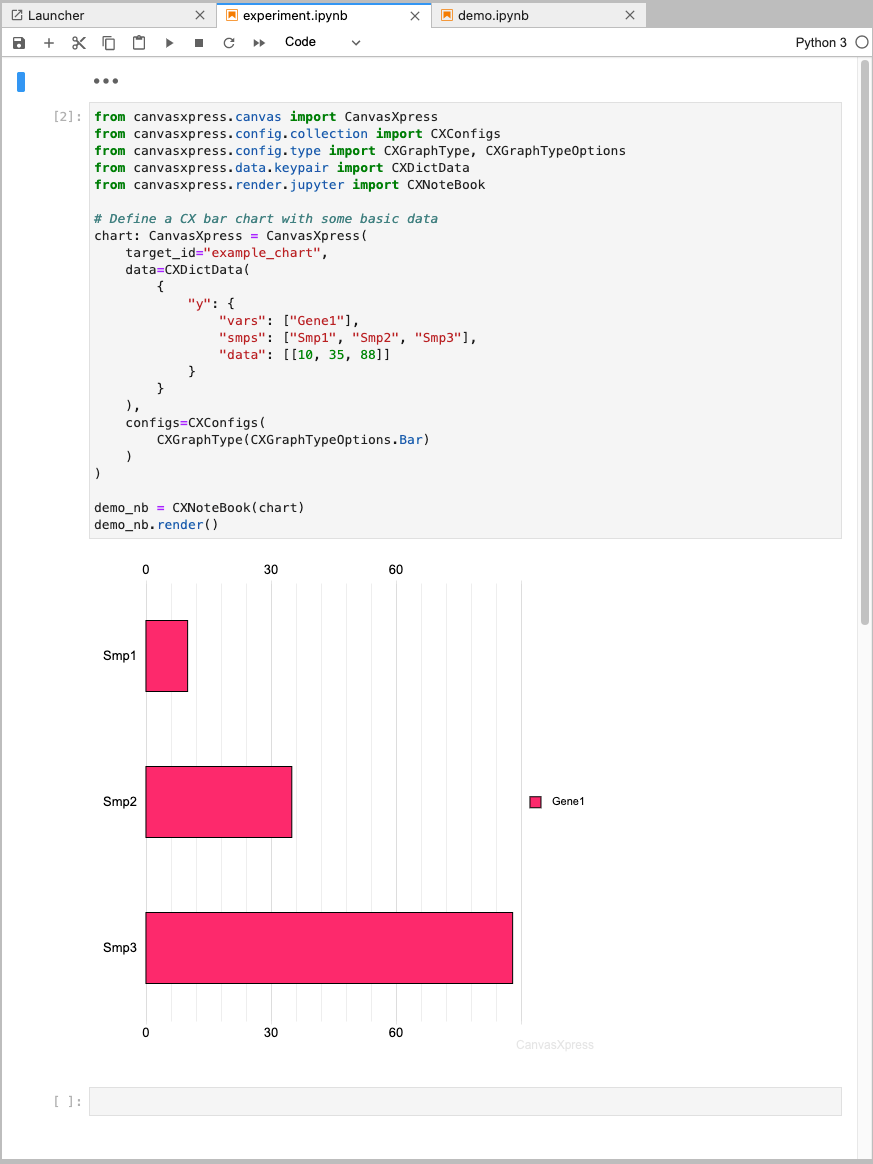
Congratulations! You have created your first IPython-driven CanvasXpress chart!
Using Chart Options to Create an Interesting Illustration
The CanvasXpress site maintains many useful examples, of which one is a Scatter
3D chart that makes use of the iris data set.
Read about it here.
The following example converts the Javascript into the Python equivalent to produce the exact same chart as produced by the example. You can learn more about the options used in this example, in addition to others, in our API Documentation.
from canvasxpress.canvas import CanvasXpress
from canvasxpress.config.collection import CXConfigs
from canvasxpress.config.type import CXGraphType, CXGraphTypeOptions
from canvasxpress.data.keypair import CXJSONData
from canvasxpress.render.jupyter import CXNoteBook

# Configure a Scatter3D chart
chart_options = CXConfigs()
chart_options \
    .add(CXGraphType(CXGraphTypeOptions.Scatter3D)) \
    .set_param('axisTickScaleFontFactor', 0.5) \
    .set_param('axisTitleScaleFontFactor', 0.5) \
    .set_param('colorBy', 'Species') \
    .set_param('theme', 'CanvasXpress') \
    .set_param('title', 'Iris Data Set') \
    .set_param('xAxis', ['Sepal.Length']) \
    .set_param('yAxis', ['Sepal.Width']) \
    .set_param('zAxis', ['Petal.Length'])

# Create the chart
chart = CanvasXpress(
    render_to="iris_scatter3d_example",
    data=CXJSONData(
        "https://raw.githubusercontent.com/docinfosci/canvasxpress-python/"
        "develop/readme/examples/iris.json"
    ),
    config=chart_options
)

# Render into Jupyter
iris_scatter3d_nb = CXNoteBook(chart)
iris_scatter3d_nb.render()
Other Examples
Reading Cloud Data
CanvasXpress for Python does not directly support non-local data, such as that obtained from a URL; however, it does support the pandas package. pandas supports loading data from URLs and databases.
import pandas as pd
from canvasxpress.canvas import CanvasXpress
from canvasxpress.config.collection import CXConfigs
from canvasxpress.config.type import CXGraphType, CXGraphTypeOptions
from canvasxpress.data.matrix import CXDataframeData

chart: CanvasXpress = CanvasXpress(
    render_to="example_chart",
    data=CXDataframeData(
        pd.read_csv("https://raw.githubusercontent.com/cs109/2014_data/master/countries.csv")
    ),
    config=CXConfigs(
        CXGraphType(CXGraphTypeOptions.Bar)
    )
)

# ...
Javascript Events
CanvasXpress provides support for Javascript events via hook functions that are called when events occur, such as mouse movement or clicks.
These events are supported via the canvasxpress.js sub-package. The CXEvents
class provides collection functionality for sets of CXEvent objects, which hold
the Javascript instructions for Web events.
An example event for graph clicks with popup information is:
from canvasxpress.js.function import CXEvent

CXEvent(
    id="click",
    script="""
    var s = 'click on var ' + o.y.vars[0] + ' and smp ' + o.y.smps[0];
    t.showInfoSpan(e, s);
    """
)
The general template of a CanvasXpress Javascript hook function is:
function (o, e, t) {
    // script logic goes here
};
The CXEvent object maps the id parameter to the hook event and the script
parameter to the function body. The CXEvents object manages collections of
CXEvent objects and renders them correctly for use with CanvasXpress in the
browser.
from canvasxpress.canvas import CanvasXpress
from canvasxpress.config.collection import CXConfigs
from canvasxpress.config.type import CXGraphType, CXGraphTypeOptions
from canvasxpress.data.keypair import CXDictData
from canvasxpress.js.collection import CXEvents
from canvasxpress.js.function import CXEvent
from canvasxpress.render.jupyter import CXNoteBook
# Define a CX bar chart with some basic data
chart: CanvasXpress = CanvasXpress(
render_to="example_chart",
data=CXDictData(
{
"y": {
"vars": ["Gene1"],
"smps": ["Smp1", "Smp2", "Smp3"],
"data": [[10, 35, 88]]
}
}
),
config=CXConfigs(
CXGraphType(CXGraphTypeOptions.Bar)
),
events=CXEvents(
CXEvent(
id="click",
script="""
var s = 'click on var ' + o.y.vars[0] + ' and smp ' + o.y.smps[0];
t.showInfoSpan(e, s);
"""
)
)
)
demo_nb = CXNoteBook(chart)
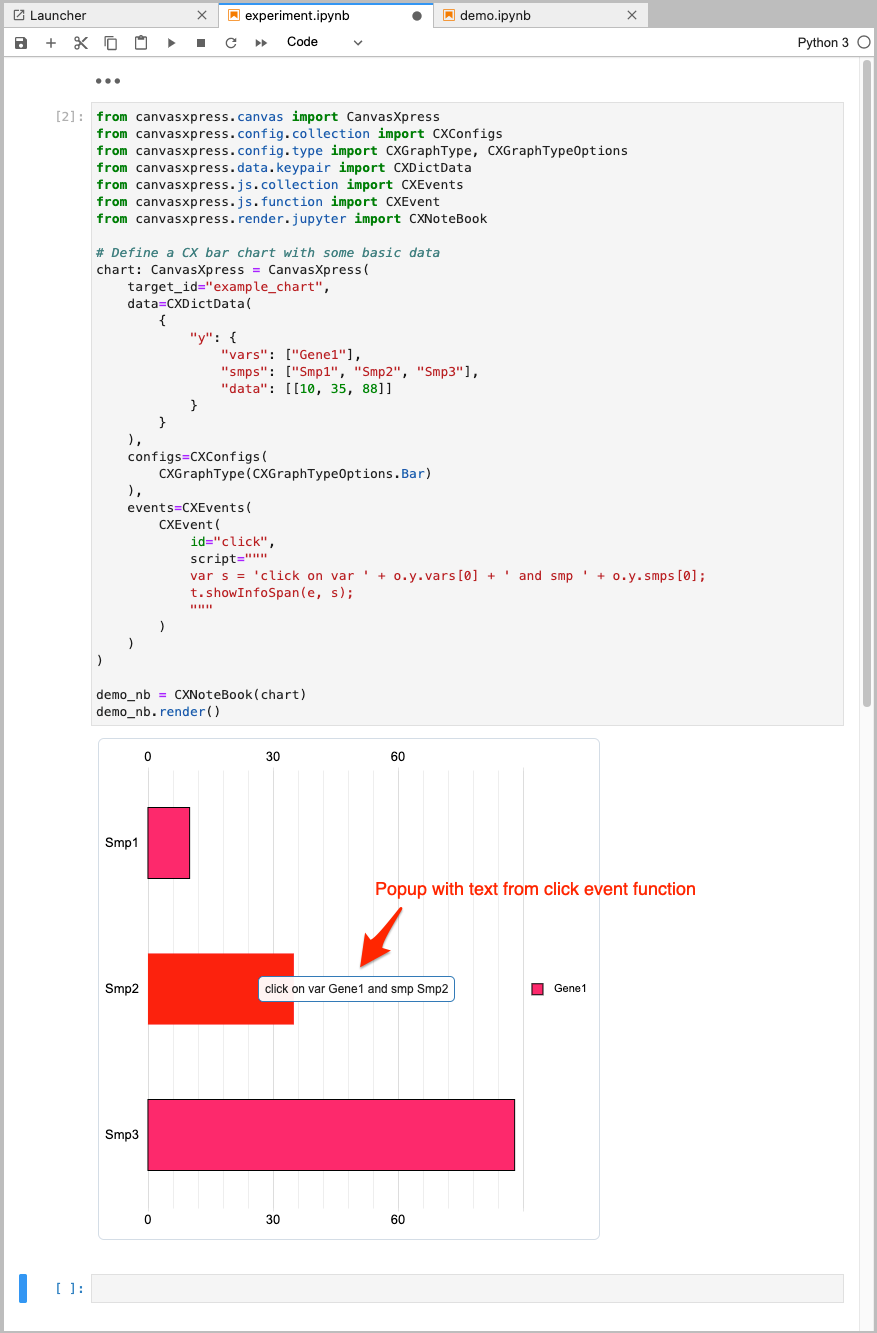
demo_nb.render()
Now clicking on the chart displays the information per our custom event:
Adding Multiple Configuration Options at Once
CanvasXpress charts can make use of numerous configuration options as part of
chart formatting. CXConfigs provides support for parameter chaining to ease
large sets of options.
Option lists using specific data types can be used during CXConfigs initialization:
from canvasxpress.config.collection import CXConfigs
from canvasxpress.config.type import CXString, CXBool

config: CXConfigs = CXConfigs(
    CXString("legendPosition", "bottomRight"),
    CXString("axisAlgorithm", "rPretty"),
    CXBool("legendBox", True)
)
Chaining can be performed using specific data types:
from canvasxpress.config.collection import CXConfigs
from canvasxpress.config.type import CXString, CXBool

config: CXConfigs = CXConfigs()

# ...

config \
    .add(CXString("legendPosition", "bottomRight")) \
    .add(CXString("axisAlgorithm", "rPretty")) \
    .add(CXBool("legendBox", True))
Chaining can also be performed using inferred data types:
from canvasxpress.config.collection import CXConfigs

config: CXConfigs = CXConfigs()

# ...

config \
    .set_param("legendPosition", "bottomRight") \
    .set_param("axisAlgorithm", "rPretty") \
    .set_param("legendBox", True)
